

Mixed FHIR workloads are the rule in US healthcare integrations. The same deployment carries chart review, order entry, ingestion feeds, and analytics extracts on the same hardware. Each of those has a different read/write ratio, and the sizing that holds at one ratio breaks at the others. Planning the ratio explicitly is what keeps the deployment from swinging between under- and over-provisioned states as the mix shifts.
For the surrounding sizing context, more on FHIR for US healthcare teams is the collection on the home page. This one stays on the specific ratio question.
Naming the Ratios by Workflow
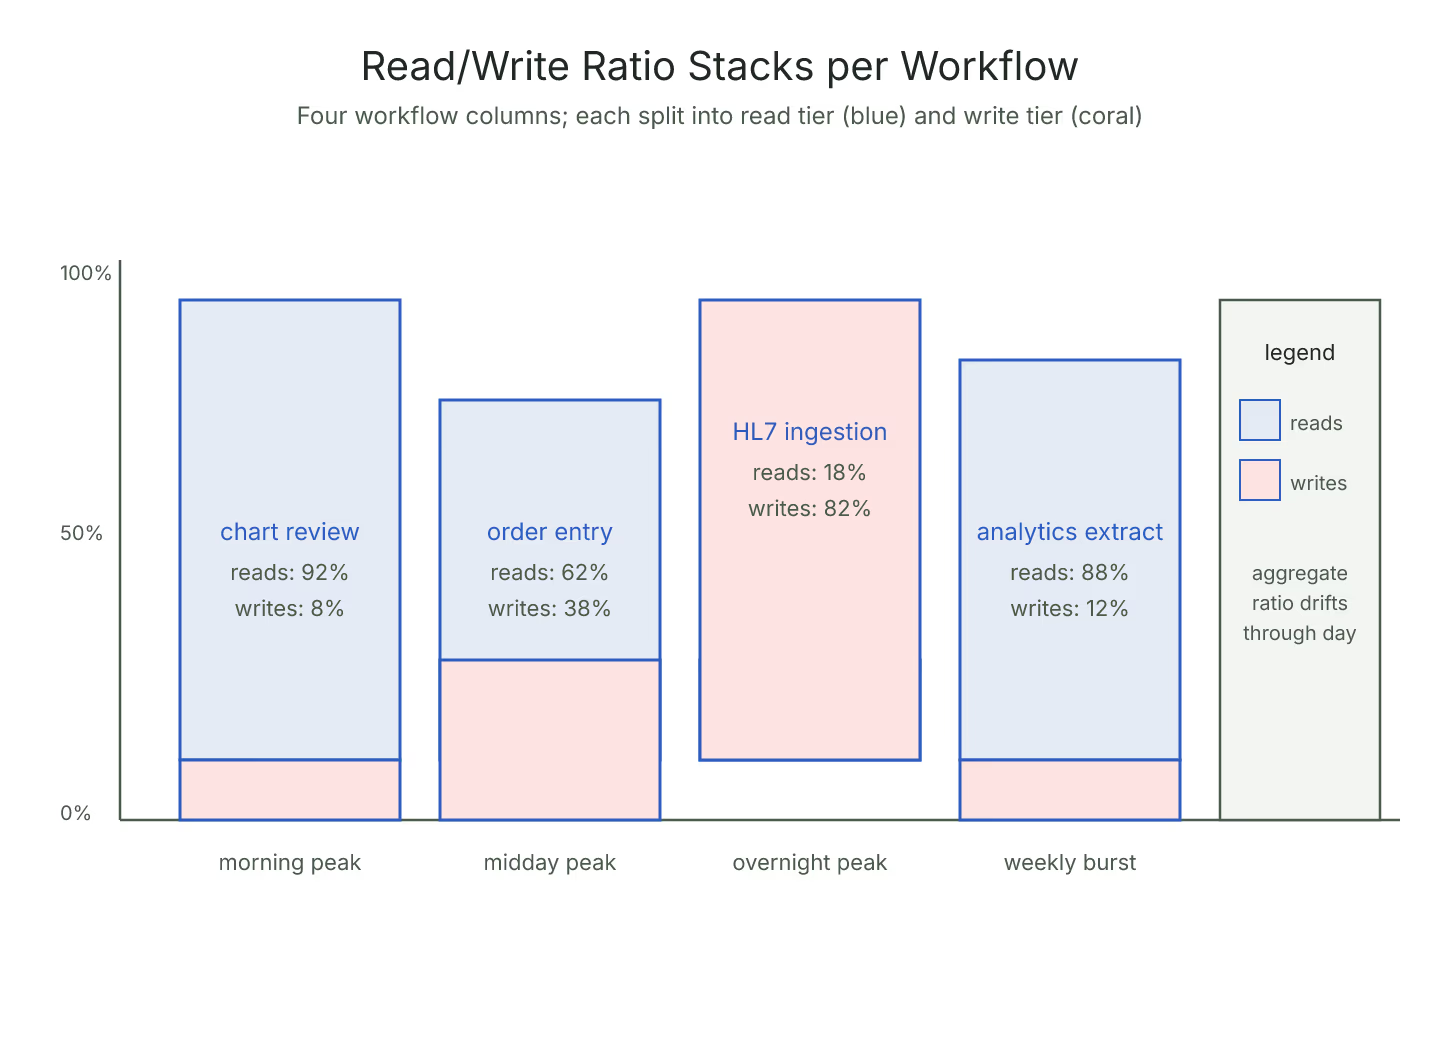
Every clinical workflow carries its own ratio. Chart review is nearly all reads. Order entry is close to fifty-fifty. HL7 ingestion feeds are almost all writes. Analytics extracts are pure reads at low frequency and high size.
Naming the ratio for each workflow in the deployment is the first step. Not every workflow contributes equally to the mix; the ones with the highest traffic drive the aggregate ratio. A pass through the site's FHIR server throughput sizing widget can turn a ratio number into a first-pass server split.
The Aggregate Is a Weighted Average
The overall deployment ratio is a weighted average of the workflow ratios. A deployment with sixty percent chart-review traffic and forty percent ingestion traffic runs closer to eighty-twenty reads-to-writes than fifty-fifty, because chart review dominates the mix.
Weighted averages hide something important though: the ratio changes across the day. Peak chart-review hours are morning through late afternoon; peak ingestion hours are overnight. The aggregate ratio at 10am is not the same as at 2am, and the sizing plan has to hold at both extremes.
Peak Ratios per Time Window
The sizing plan should include the read and write peak in the same day, even if the peaks do not coincide. A cluster sized for the read peak will handle the write peak comfortably; a cluster sized for the write peak might struggle at the read peak because caches are smaller relative to the workload.
For the individual read-side inputs, the numbers you actually need to estimate FHIR read RPS walks through the formula. The write side follows the same pattern with a different formula.
Ratio Shifts as Workflows Onboard
The mix rarely stays fixed. Every new workflow onboarded shifts the aggregate ratio, sometimes noticeably. A new ingestion feed that adds five hundred writes per second turns a comfortable eighty-twenty deployment into a fifty-fifty deployment overnight.
The sizing plan should include a onboarding checklist: what does this workflow's ratio look like, what is its expected traffic share, and what does the new aggregate ratio become. Without the checklist, ratio shifts happen invisibly and the deployment discovers them under load.
The Cache Sizing Depends on the Ratio
Cache sizing is the operational variable that changes fastest with ratio. Read-heavy workflows benefit from large session and reference caches. Write-heavy workflows churn caches faster and reduce the effective hit rate, which pushes more traffic to the backend.
Plans that fix cache sizes at deployment time and never revisit them tend to accumulate ratio drift over months. The disciplined pattern is a quarterly cache-sizing review that reads the current ratio and adjusts.
Ratio-Aware Sizing Beats Total-RPS Sizing
Total RPS is a useful headline number, but it hides the ratio underneath. Sizing that reports RPS without the ratio invites capacity conversations to reopen every time the mix shifts. Sizing that reports read RPS, write RPS, and their expected peaks separately holds up under those conversations.
For the workflow-to-RPS translation that feeds the ratio, translating clinical workflow into FHIR API load is the accompanying method. Planning the ratio explicitly is the discipline that keeps mixed workloads from breaking a plan sized against averages.
Sources
- HL7 FHIR Bulk Data Access IG covering read-heavy analytics - HL7 FHIR Bulk Data Access IG covering read-heavy analytics workflows in a mixed FHIR deployment